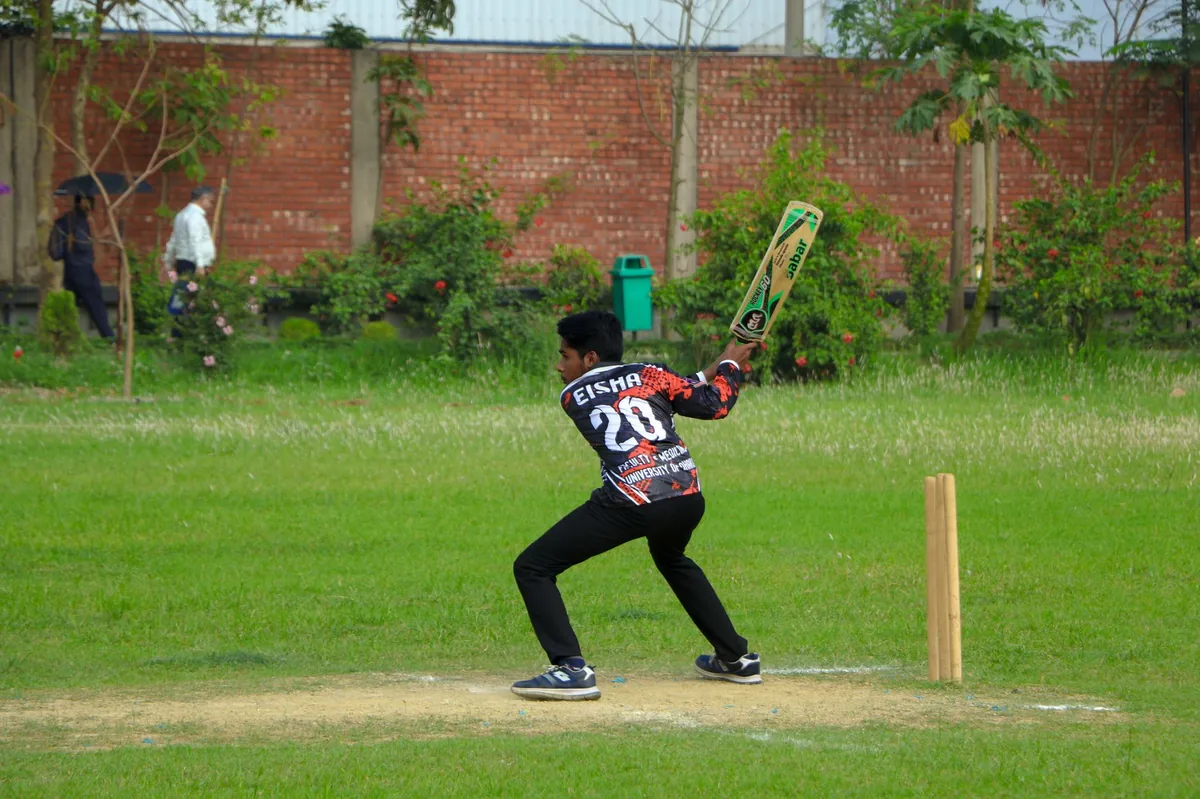
Why Parents and Players Care About Match Statistics
When a 13‑year‑old from Lucknow brings home a scorecard from a district tournament, the first question from a parent is usually, “What does this tell us about his future?” In today’s data‑driven world, raw numbers are often taken as the sole indicator of talent. However, without context, a high strike rate or a low economy can be misleading. Understanding which statistics genuinely matter helps you set realistic goals, choose the right coaching environment, and avoid spending money on unnecessary gadgets or short‑term camps.
Core Batting Statistics Every Young Cricketer Should Track
Runs Scored and Consistency
Runs per innings is the most obvious metric, but it should be paired with average (total runs ÷ dismissals). A player who scores 30, 35, 32 in three matches shows consistency, even if the total is lower than a single 80‑run knock. Consistency is what selectors at the district and state level look for because it signals reliability under different conditions.
Strike Rate and Boundary Percentage
For limited‑overs formats, strike rate (runs per 100 balls) matters, but the boundary percentage (percentage of runs from fours and sixes) adds nuance. A high strike rate built on singles may indicate good rotation, while a high boundary percentage shows the ability to accelerate—both valuable in different match phases.
Dismissal Types
Recording how a player gets out—caught, bowled, LBW, run‑out—helps identify technical flaws. Frequent LBWs may point to a weakness against the line, while many catches behind the wicket could highlight a timing issue against pace.
Essential Bowling Metrics for Young All‑Rounders
Wickets and Bowling Average
Wickets taken is a headline figure, yet the bowling average (runs conceded ÷ wickets) provides a clearer picture of effectiveness. A bowler who grabs three wickets for 70 runs (average ≈ 23) is often more valuable than one who takes two wickets for 20 runs (average = 10) if the latter bowls only a few overs.
Economy Rate and Dot‑Ball Percentage
In youth one‑day and T20 games, economy rate (runs per over) is scrutinised. Complement this with dot‑ball percentage—the proportion of deliveries that yield no run. Consistently building pressure forces the opposition into mistakes, a skill that selectors reward even if wickets are scarce.
Types of Dismissals
Tracking whether a bowler gets batsmen out bowled, caught, or LBW helps tailor coaching drills. A spinner with many LBWs but few bowled dismissals may need to work on flight and turn, whereas a fast bowler with many catches might focus on seam position.
Fielding Numbers That Show Real Impact
Catches, Run‑Outs and Stumpings
Fielding is often the differentiator at higher levels. Simple counts of catches taken, run‑outs effected, and for wicket‑keepers, stumpings, give a baseline. More advanced metrics like fielding efficiency (successful chances ÷ total chances) highlight reliability.
Saving Runs
Saving runs through quick returns, diving stops, or accurate throws does not always appear on a scorecard, but video analysis combined with a tally of “saved runs” can be a powerful indicator of a player’s defensive value.
How to Collect Accurate Statistics
Most schools and clubs in Uttar Pradesh keep basic scorebooks, but they often miss detailed data. Consider these low‑cost tools:
- Mobile apps such as CricHQ or Cricket‑Stats that let a coach or parent log every ball in real time.
- Video recordings on a smartphone; free editing software can help tag dismissals and dot balls.
- Spreadsheet templates shared among teammates to capture runs, overs, catches, and dismissal types after each match.
Consistency in data entry is more important than sophisticated software. A simple, regularly updated spreadsheet will give you trends over a season.
Interpreting Numbers in Context
Numbers alone can be deceptive. A batting average of 45 on a flat, small ground carries a different weight than the same average on a slow, turning pitch. Likewise, a bowler’s economy of 4.5 in a 50‑over match on a batting‑friendly wicket is impressive, whereas the same figure on a bowler‑friendly pitch is merely average.
When analysing stats, ask:
- What was the quality of opposition? (District vs. inter‑state)
- What were the pitch and weather conditions?
- How many matches form the sample? (A single game can skew averages.)
Using these filters prevents over‑reacting to outliers and helps you set realistic development targets.
Turning Statistics into Development Plans
Once you have a clear statistical picture, work with the coach to translate numbers into drills. For example:
- If a batsman’s boundary percentage is low, incorporate power‑hitting drills with a weighted bat.
- If a bowler’s dot‑ball percentage is below 30 %, practice yorker and slower‑ball variations to improve control.
- If a fielder’s catch conversion rate is 60 %, add high‑catch drills and reaction‑time exercises.
Regularly revisiting the stats after each tournament creates a feedback loop that keeps training focused and measurable.
Cost Considerations and Common Risks
Investing in data collection and analysis can add up. Subscription fees for premium apps range from ₹1,000 to ₹3,000 per month, while hiring a specialist statistician for a season can exceed ₹20,000. Travel for higher‑level tournaments, equipment upgrades, and private coaching also strain family budgets.
Beyond finances, an over‑emphasis on numbers can lead to burnout or a loss of enjoyment. Young players may start playing for the “average” rather than the love of the game, which can hamper long‑term growth.
Bridge to Structured Financial Support
If you’re worried about the expense of quality coaching, equipment, and data tools, a structured scholarship can ease the burden. Eligible and committed players from Lucknow, nearby districts of Uttar Pradesh, or even Bihar can explore the Lucknow Cricket Scholarship. The program offers residential coaching, access to professional trainers, and often covers kit and nutrition, allowing families to focus on performance rather than fees.
How the Lucknow Cricket Scholarship Can Help
While the scholarship does not guarantee a place in the IPL, it provides a clear pathway:
- Professional coaching under certified coaches familiar with BCCI’s talent‑identification process.
- Regular match exposure in inter‑academy leagues, giving more data points for statistical analysis.
- Access to performance analytics tools that many private academies charge extra for.
- Financial relief for families who otherwise would struggle to afford full‑time training.
Eligibility typically includes a minimum academic record, a recent trial performance, and a recommendation from a recognized coach. Because rules can change, always verify the latest criteria with the scholarship organizers.
Take the Next Step
Ready to turn promising statistics into a solid development plan without breaking the bank? Eligible players can apply for the Lucknow Cricket Scholarship and gain access to structured coaching, accommodation, and performance tracking. For more details or to start the application process, call +91 9695934706 today.
Conclusion: Balancing Numbers and Passion
Statistics are a powerful compass for young cricketers, helping parents and coaches pinpoint strengths, set measurable goals, and showcase talent to selectors. Yet they must be used alongside game sense, mental resilience, and genuine enjoyment of cricket. By collecting the right data, interpreting it wisely, and considering affordable pathways like the Lucknow Cricket Scholarship, families can nurture talent sustainably and keep the love for the sport alive.